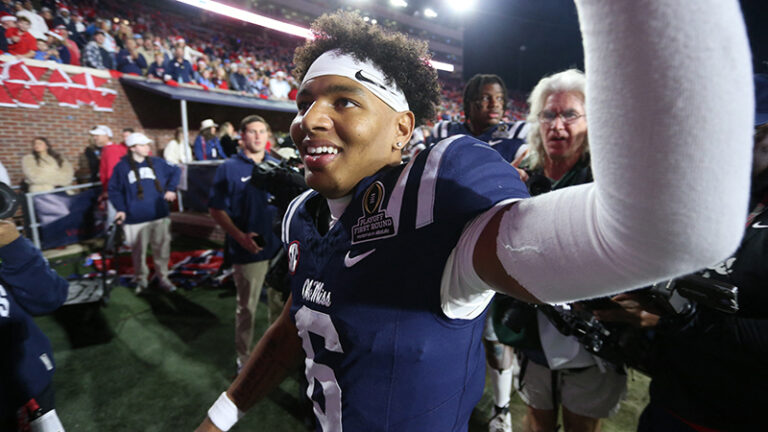
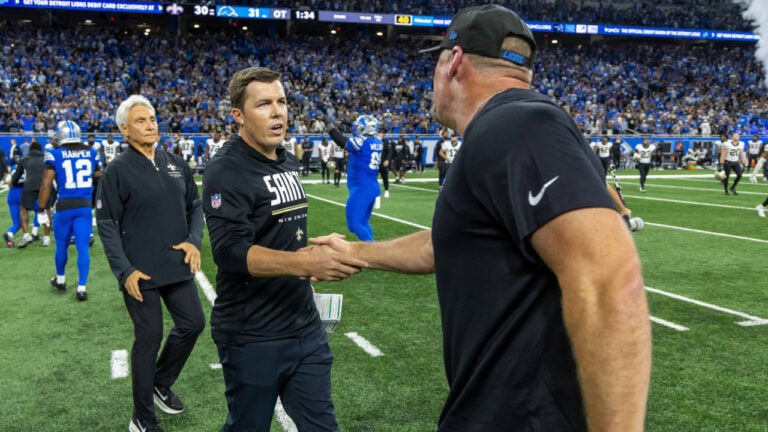
It wasn’t the start to the season that the New Orleans Saints wanted, dropping their opening game to the Detroit Lions 31-30 in overtime. However, the team’s ability to bounce back in the second half, closing a 21-0 deficit through the first two-and-a-half quarters, has given the team some momentum going into Week 2 against the Baltimore Ravens.
The surge, led by quarterback Tyler Shough, has the team ranked highly in all major passing metrics, an area the team will look to continue to rely upon as the season continues.
The Saints will travel for another tough matchup, taking on Baltimore and their outstanding rushing attack led by both running back Derrick Henry and quarterback Lamar Jackson.
Ahead of the 12:00 p.m. CT kickoff, here is a quick look at how both teams compare across some of the game’s major statistical categories through the first week.
Scoring Offense vs. Scoring Defense (Points Per Game)
Saints Offense – No.11 (30.0) | Ravens Defense – T-No. 14 (23.0)
Ravens Offense – T-No. 2 (41.0) | Saints Defense – No. T-No. 23 (31.0)
Both teams are within the top-half of the NFL in points scored in the first week, with Baltimore being one of two teams to cross the 40-point threshold, while the Saints were one of 11 teams to score 30 or more.
This week’s game will present both teams with talented defenses to provide a gauge and learn
whether or not their previous success was more about their own offense or the opposition.
The Saints’ defense ranks low after surrendering 31 points, but through the first half of the game, they held Detroit to just seven points. It wasn’t until back-to-back turnovers when the Lions gained seperation.
Point Differential
Saints – minus-1 (No. 17) | Ravens – plus-18 (No. 5)
While the Saints were able to close the gap against Detroit, the Indianapolis Colts stood no chance marching up against Baltimore in last week’s opener. While the Ravens were able to win with a 41-point output, the team still surrendered 23 points, signaling a possible vulnerability the Saints hope to exploit.
Passing Offense vs. Passing Defense (Yards Per Game)
Saints Offense – No. 1 (378.0) | Ravens Defense – No. 5 (149.0)
Ravens Offense – No. 4 (304.0) | Saints Defense – No. 18 (204.0)
The Saints rank No. 1 in the NFL in passing yards, passing touchdowns and passing attempts after their overtime showdown with the Lions. This will be the most evenly matched area of the game. While New Orleans’ passing defense is ranked outside of the top half of the league, the extra frame of overtime play is what really did them in.
Through just four quarters, New Orleans had allowed just 162 passing yards, which would have them ranked No. 8 in the league.
How the Saints manage to minimize the yards after catch impact of explosive Ravens wideout Zay Flowers may be the key. He had 150 yards receiving in Week 1, including a blazing 54-yard catch-and-run touchdown.
Meanwhile, the Ravens matching up with Saints wide receiver Chris Olave, who had a career high in receiving yards with 182 against the Lions, will be a big factor for both teams. Finding the second and third options behind each team’s go-to pass catcher may end up being the most important difference maker.
Rushing Offense vs. Rushing Defense (Yards Per Game)
Saints Offense – No. 22 (91.0) | Ravens Defense – T-No. 13 (102.0)
Ravens Offense – No. 3 (202.0) | Saints Defense – T-No. 27 (165.0)
The Saints’ rushing offense and defense both underperformed to expectations to kick off the 2026 season and now will face another difficult matchup in Baltimore.
The Colts found their rushing opportunities, but had to bail on that phase of the game as the score quickly got out of hand. When Indianapolis was able to commit to its rushing attack, running back Jonathan Taylor averaged 5.3 yards per carry.
The Saints will look to take advantage early of the rushing game, while trying to keep the score manageable. Head coach Kellen Moore is hoping to have both top running back options Travis Etienne Jr. and Alvin Kamara available this week, maximizing his options in trying to take advantage of the vulnerability while it’s available.
Both defenses are among the eight units to surrender more than five yards per carry through Week 1.
Turnover Differential
Saints – minus-2 (T-No. 26) | Ravens – plus-1 (T-No. 8)
Through the earliest portion of the season, the Saints’ offense committed three turnovers in their opener. Meanwhile, the Ravens forced two takeaways, one interception and one fumble recovery, while Jackson lost a fumble.
Third Down Conversion Rate
Saints Offense – 47.1% (No. 10) | Ravens Defense – 30.0% (No. 11)
Ravens Offense – 33.3% (T-No. 17) | Saints Defense – 38.5% (T-No. 17)
Shough maintained his third-down heroics from 2025 in the team’s opener, helping the Saints convert eight of 17 third-downs conversions against the Lions, particularly in the second half and overtime. The difference this year, though, was that he extended that efficiency to fourth down.
Shough finished his season debut with a 118.8 passer rating on fourth down, second best in the NFL.
Pressure Rate Allowed vs. Generated
Saints Offense – 35.5% (No. 14) | Ravens Defense – 41.2% (No. 9)
Ravens Offense – 48.3% (No. 28) | Saints Defense – 22.0% (No. 31)
After an offseason, the Saints’ defense is right back at the bottom of the league in pressure percentage generated through the first week. That happened against a Lions offensive line with a rookie starting at right tackle, a backup center and eventually a backup left guard as well. That wasn’t the production the Saints’ wanted, nor expected, from its pass rush after an exciting training camp for the unit.
Against the Ravens, it appears that the Saints will have a number of opportunities. Baltimore allowed one of the NFL’s 10 highest pressure percentages in its season opener, which led to a pair of sacks surrendered on just 29 dropbacks.