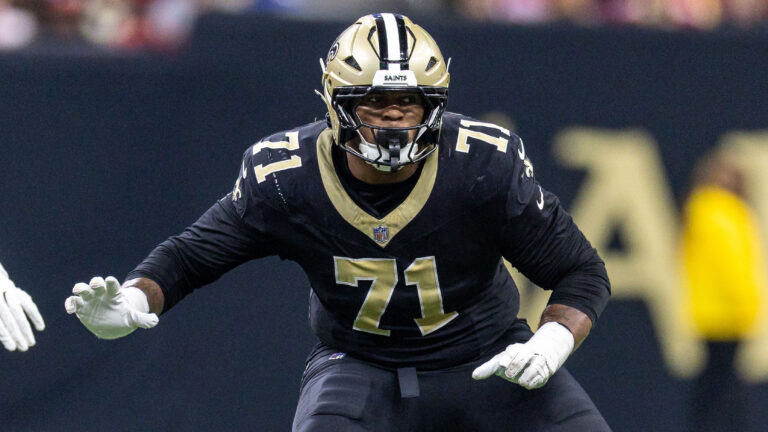
After being on the road for the first two games of the season, the New Orleans Saints are finally ready to open their home schedule with a showdown on Sunday with the Las Vegas Raiders.
The offensive fireworks between Saints head coach Kellen Moore and Raiders head coach Klint Kubiak (formerly the Saints offensive coordinator) are sure to be a spectacle as the two teams lock horns.
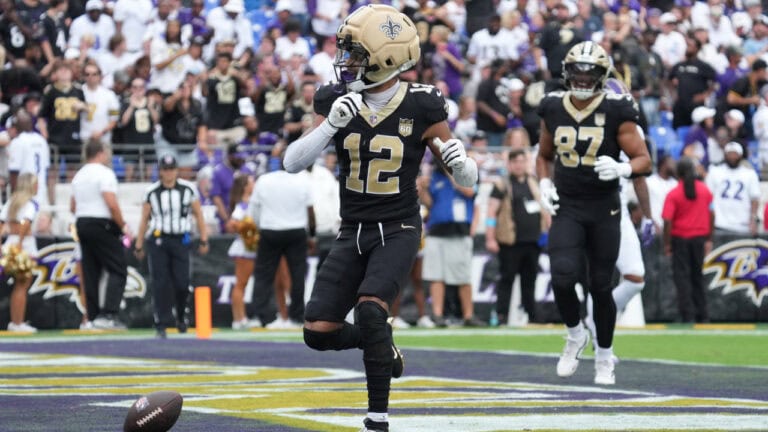
The Saints are coming off of a surprising win on the road against the Baltimore Ravens in Week 2, while the Raiders are off to an impressive 2-0 start with some key playmakers and investments that have not yet made their debuts.
Ahead of the Saints’ first afternoon game, a 3:25 p.m. CT kickoff, here is a look at how both teams compare across some of the game’s major statistical categories through the first week.
Scoring Offense vs. Scoring Defense (Points Per Game)
Saints Offense – No.11 (27.0) | Raiders Defense – No. 5 (13.5)
Raiders Offense – T-No. 10 (26.5) | Saints Defense – No. T-No. 18 (24.0)
Both teams have been high-performing teams from a scoring perspective with the Raiders being top-10 in first half scoring, while the Saints are tied for No. 31 in the league in that metric.
Meanwhile, the Saints have been the highest-scoring team in the NFL in the second half, while the Raiders are tied for the No. 12 spot.
The two go hand-in-hand with one another, but it will be an interesting dynamic to watch during this game.
Point Differential
Saints – plus-6 (T-No. 15) | Raiders – plus-26 (No. 3)
The Raiders’ two wins, over the Miami Dolphins and Los Angeles Chargers, haven’t been particularly close, winning by multiple scores in both games. Meanwhile, the Saints have been comeback kings, closing a 21-0 deficit in Week 1 and securing a win in Week 2 despite trailing by 11 at one point.
Passing Offense vs. Passing Defense (Yards Per Game)
Saints Offense – No. 2 (305.5) | Raiders Defense – No.11 (184.0)
Raiders Offense – T-No.16 (204.0) | Saints Defense – No. 15 (204.0)
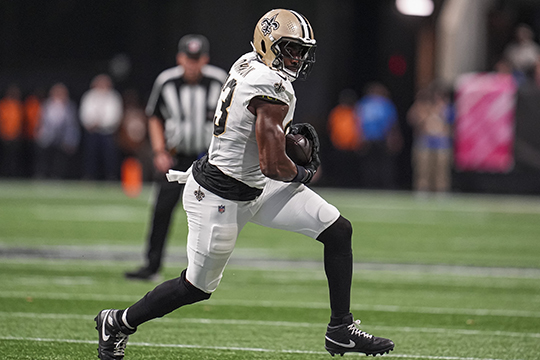
The Saints entered the season wanting to set up their offense with the run game but have been an entirely different team through the opening games. New Orleans’ passing offense has carried most of the load, especially in the second half while looking to close deficits. Quarterback Tyler Shough has been outstanding and currently leads the NFL in passing yards with 662. Meanwhile, wide receiver Chris Olave is No. 2 in the league in receiving yards with 268.
The Raiders have been a middle-of-the-road team in the passing game with tight end Brock Bowers sidelined but haven’t had much issue finding the end zone anyway.
Quarterback Kirk Cousins has completed better than 67% of his attempts and has tossed six touchdowns passes, tied for the NFL lead.
Rushing Offense vs. Rushing Defense (Yards Per Game)
Saints Offense – No. 28 (78.0) | Raiders Defense – No. 15 (100.5)
Raiders Offense – No. 23 (93.5) | Saints Defense – No. 27 (136.5)
Neither team’s rushing offense has been particularly threatening, so the difference here may be the defenses. Raiders running back Ashton Jeanty, an explosive second-year back, topped 100 rushing yards in his first game, but was held to just 48 against the Chargers in their Week 2 clash.
The Saints’ distribution of running back carries has been a curious one. Big-ticket running back Travis Etienne Jr. has not gotten going in the ground game consistently, as he’s been afforded a surprisingly low amount of opportunities early in games while the score is still manageable.
Playing for the first time in front of his home state fans, Etienne should be a greater focal point of the offense than he has been in the opening weeks.
Turnover Differential
Saints – minus-1 (T-No. 20) | Raiders – plus-2 (T-T-No. 5)
Las Vegas didn’t take the ball away much in 2025, but they’ve started off hot in 2026, forcing five turnovers, No. 2 in the league.
New Orleans has forced a turnover in each of its games to start the season, but gave the ball away three times in Week 1. They were much improved in protecting the ball against the Ravens last week.
Third Down Conversion Rate
Saints Offense – 50% (No. 6) | Raiders Defense – 29.2% (TNo. 6)
Raiders Offense – 33.3% (T-No. 23) | Saints Defense – 40.9% (No. 20)
New Orleans converted over 50% of their third down tries last week, going 8 of 15 against the Ravens. But they’ll face an excellent third-down defense this week.
Meanwhile, the Raiders will take on a defense that’s allowed a heavy amount of third down conversions as they look to jump start their offense in that area. This will be an intriguing battle and one of the most important in this week’s game.
Pressure Rate Allowed vs. Generated
Saints Offense – 33.7% (No. 13) | Raiders Defense – 47.1% (No. 2)
Raiders Offense – 33.3% (No. 12) | Saints Defense – 30.8% (T-No. 28)
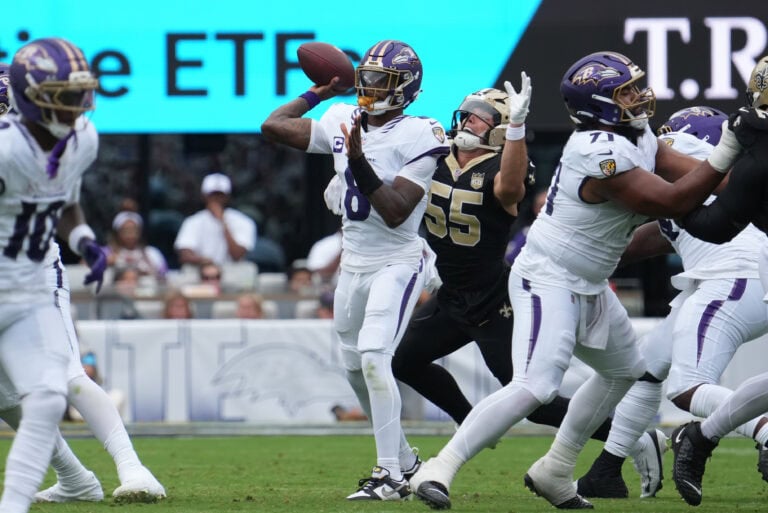
New Orleans took a major leap from the 22% defensive pressure rate it achieved in Week 1 by putting a lot of pressure on Ravens quarterback Lamar Jackson. That helped to boost their percentage more than eight points, but the team still ranks low relative to the rest of the league’s early efforts.
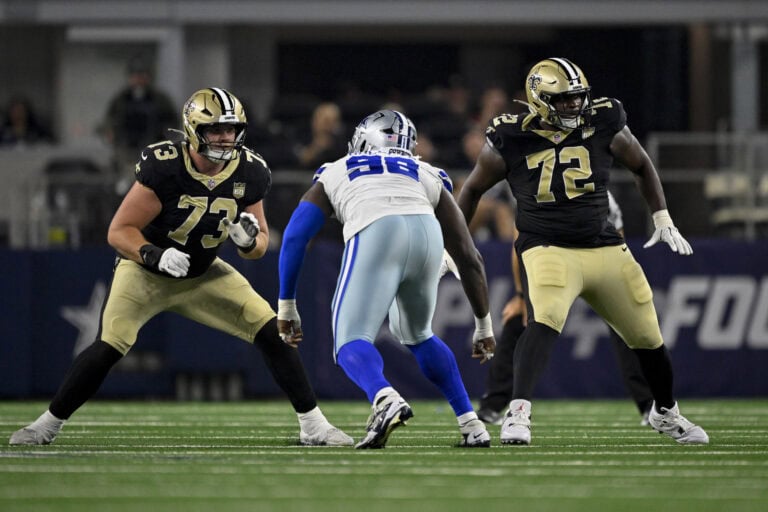
The Raiders are on the opposite side of the spectrum, consistently putting pressure on opposing passers. With budding star left tackle Kelvin Banks Jr. sidelined for the foreseeable future, keeping Shough upright against Raiders edge rusher Maxx Crosby and the Las Vegas defense is a game-changing factor to watch Sunday.