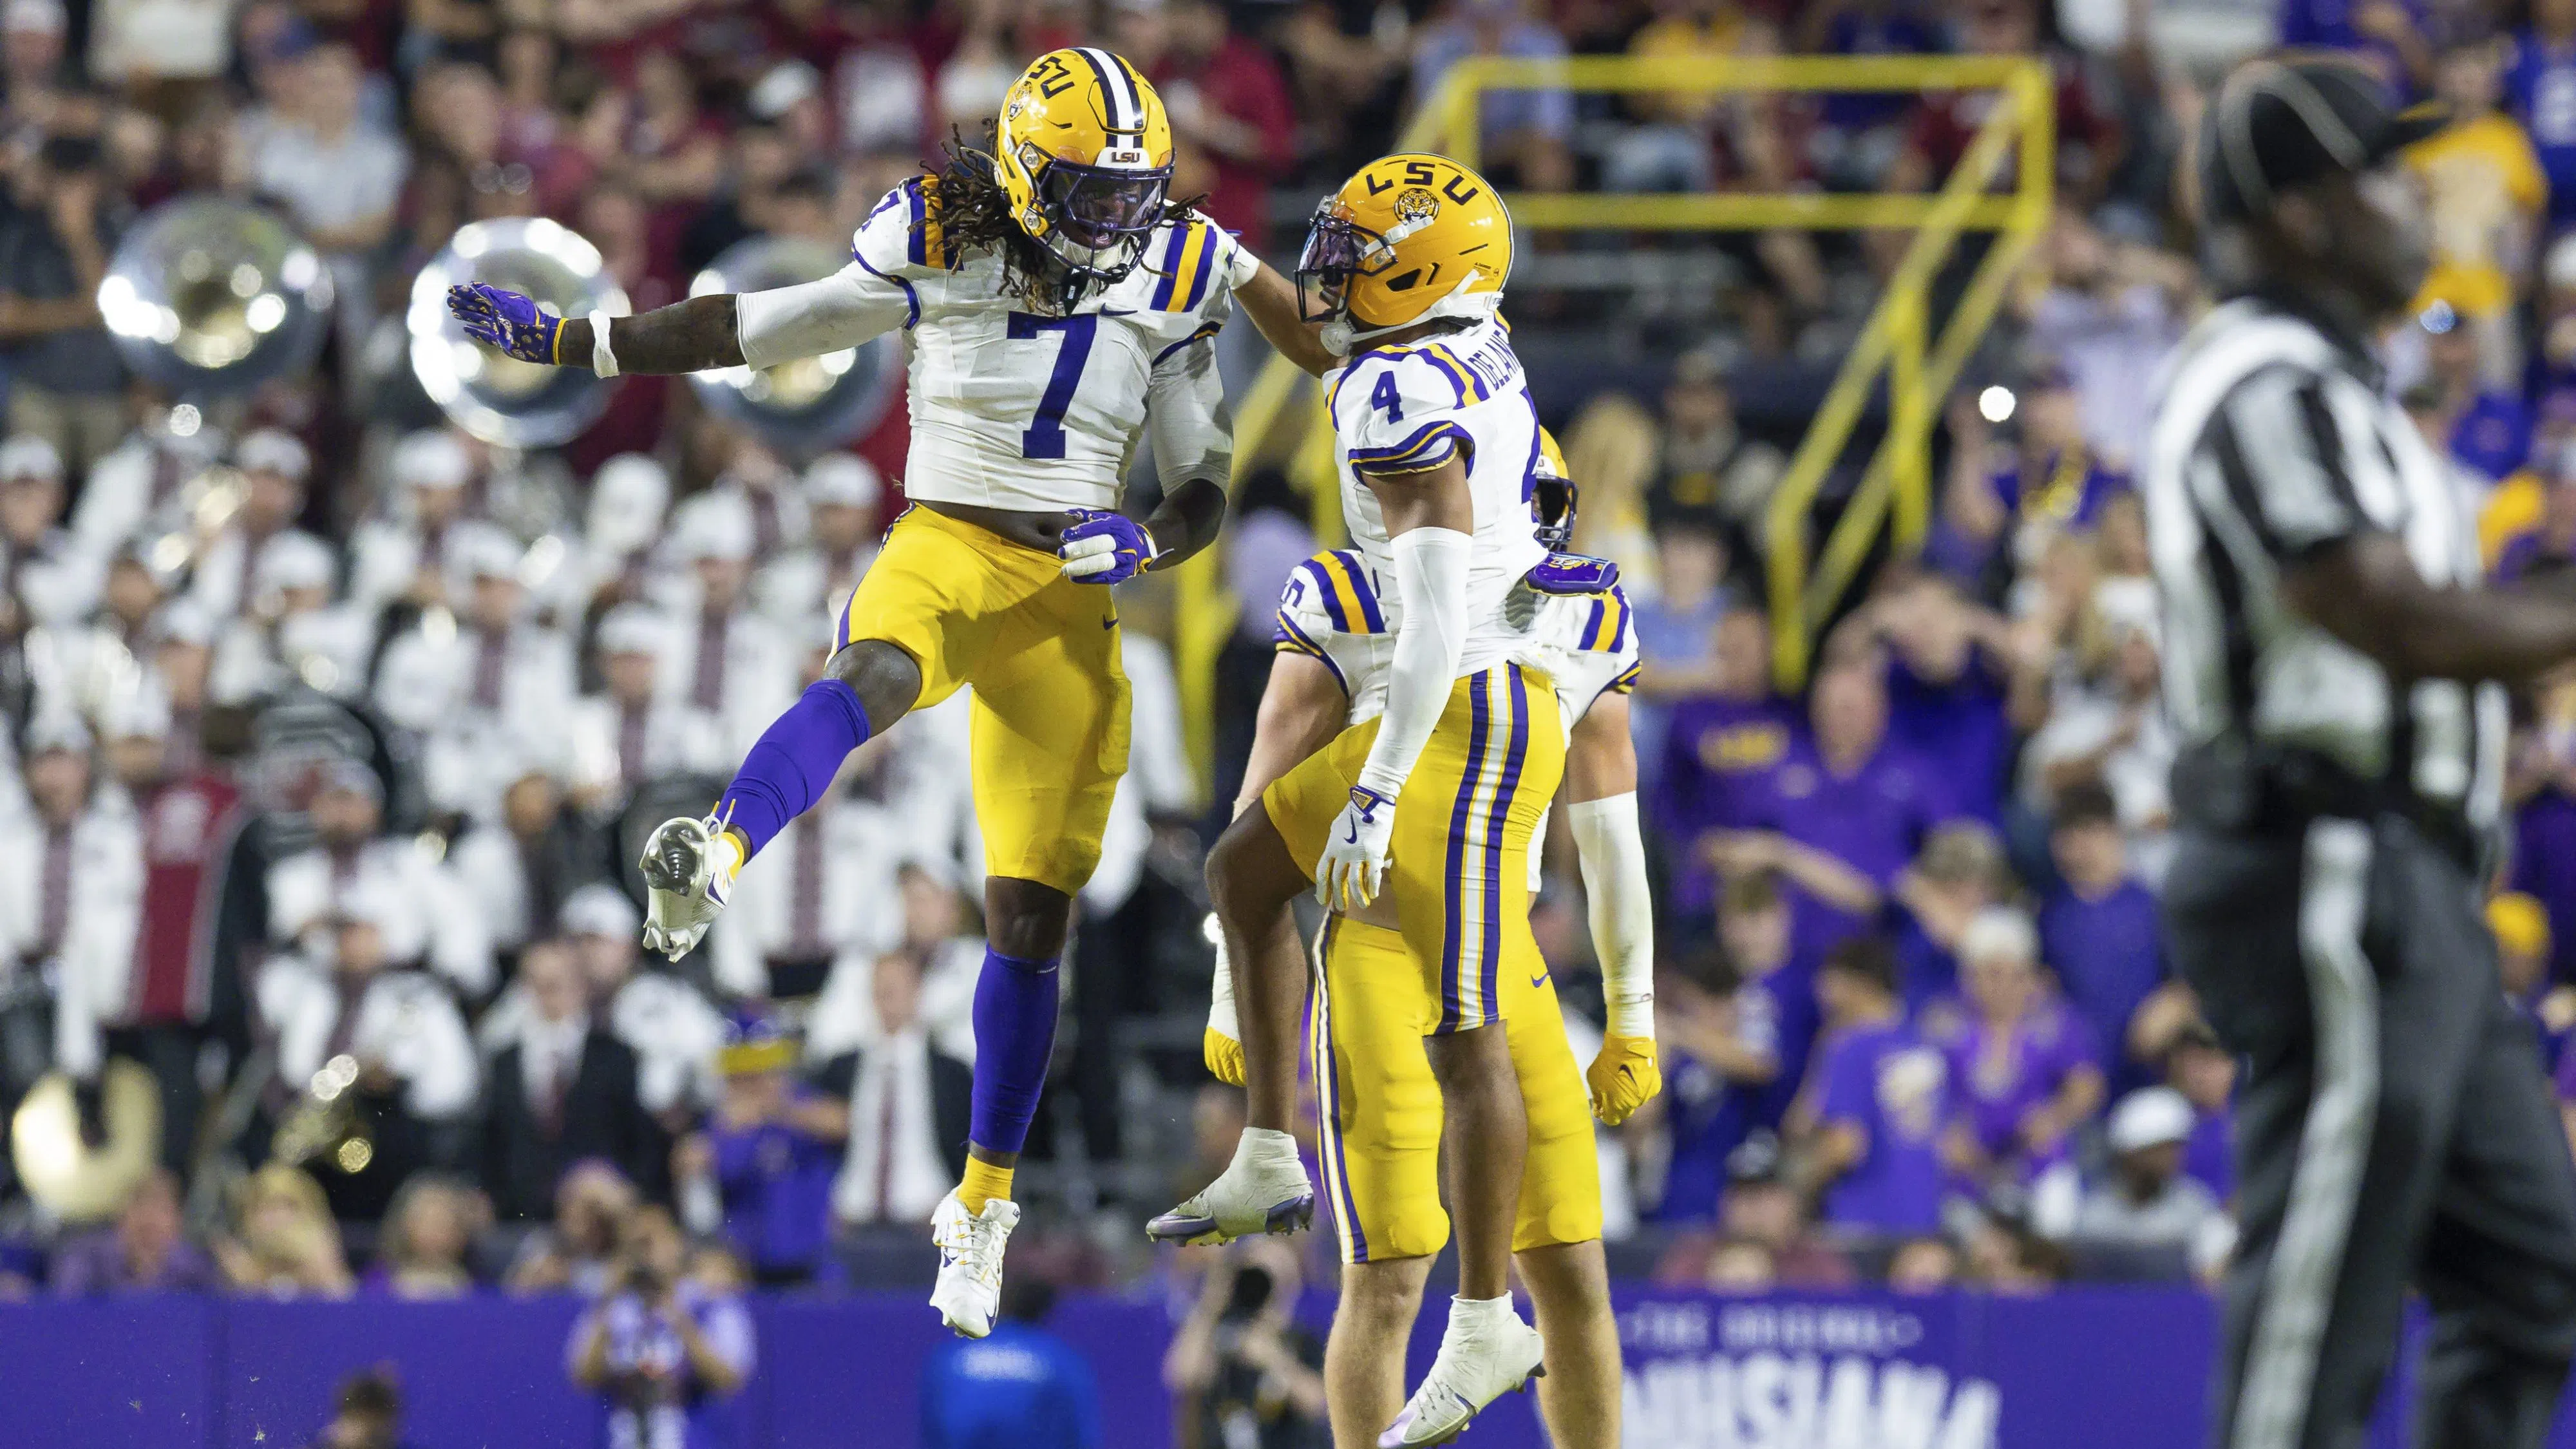
Stephen Lew-Imagn Images
By Hunt Palmer
A reminder that the smaller the ranking, the better the statistic.
Green: Top 25
Red: Bottom 50
OFFENSE
Scoring Offense: 108th, 21.8 points per game
Total Offense: 110th, 332.7 yards per game
Yards per play: 104th, 5.2 yards per play
Rushing Offense: 123rd, 106.3 yads per game
Yards per carry: 116th, 3.6 yards per carry
Rushing Attempts per game: 129th, 29.5 attempts per game
Rushing Touchdowns: 124th, 9
Passing Offense: 66th, 226.4 yards per game
Passing Attempts: 27th, 34.8 attempts per game
Completion Percentage: 35th, 65.9%
Passing Touchdowns: 73rd, 17
Interceptions Thrown: 31st, 7
First Downs: 96th, 18.9 per game
Third Down Conversions: 105th, 35%
Fourth Down Conversion attempts: 132nd, 12
Red Zone Touchdown Percentage: 124th, 48.8%
20-plus yard plays: 114th, 42 (3.5 per game)
10-plus yard runs: 126th, 35 (2.9 per game)
20-plus yard passes: 112th, 27 (2.3 per game)
Sacks Allowed: 88th, 25
Tackles For Loss Allowed: 104th, 72
Time of Possession: 39th, 30:59:67 per game
That just about tells the story. The only thing LSU didn’t do extremely poorly was attempt passes and complete passes. Those passes did not result in big plays, touchdowns, or first downs, but they completed a fair amount of them. The running game was abysmal. That continued from 2024 and worsened.
LSU ranked worse than 100th in 14 of those 22 categories (64%). There are only 136 teams in the FBS. That would have been hard to forecast in August aside from the fact that that LSU’s offense struggled mightily with the Tiger defense in camp. Most of the media, myself included, felt that had more to do with the defensive improvement. There certainly was defensive improvement, but the offense regressed in a major way.
DEFENSE
Scoring Defense: 15th, 18.3 points per game
Total Defense: 25th, 319.7 yards per game
Yards per Play Allowed: 30th, 5.0 yards per play
Run Defense: 27th, 117.2 yards per game
Yards per Carry Allowed: 33rd, 3.6 yards per carry
Rushing Touchdowns Allowed: 40th, 14
Passing Defense: 40th, 202.5 yards per game
Completion Percentage Allowed: 38th, 58.1%
Yards per Passing Attempt Allowed: 28th, 6.4 yards per attempt
Interceptions: 7th, 17
Passing Touchdowns Allowed: 9th, 10
Sacks: 51st, 27 (2.3 per game)
Tackles for Loss: 87th, 62 (5.2 per game)
Third Down Defense: 21st, 33.3%
Red Zone Touchdown Percentage Allowed: 5th, 69%
20-plus yard plays allowed: 40th, 44 (3.7 per game)
10-plus yard runs allowed: 59th, 51 (4.3 per game)
20-plus yard passes allowed: 52nd, 34 (2.8 per game)
The most important statistic is scoring, and LSU was really good there. The reasons were third down defense and red zone effectiveness, specifically in the passing game.
Corey Raymond and Jake Olson’s group in the secondary did a fantastic job of taking the ball away, too.
Where LSU struggled was creating that havoc Blake Baker relies on. The Tigers didn’t pressure opposing quarterbacks and didn’t make plays behind the line of scrimmage.
When you consider the group Baker took over and the staff that was assembled over two years, you see the strides LSU made. This was one of the best defenses in the SEC.


More LSU Sports