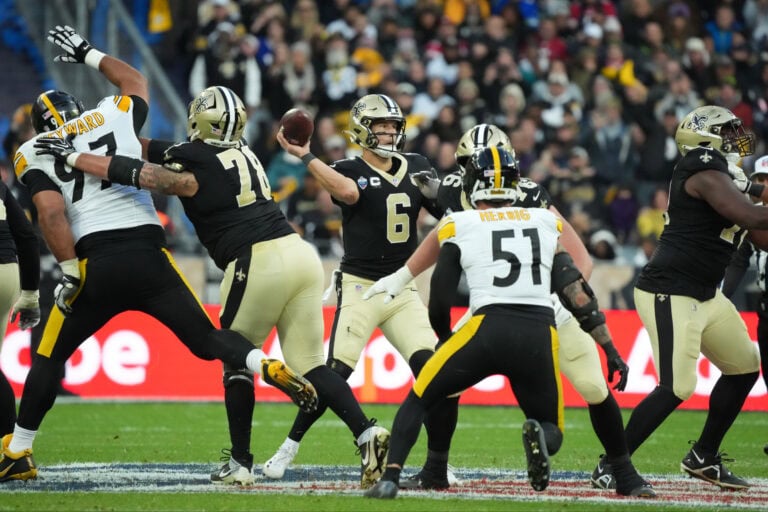
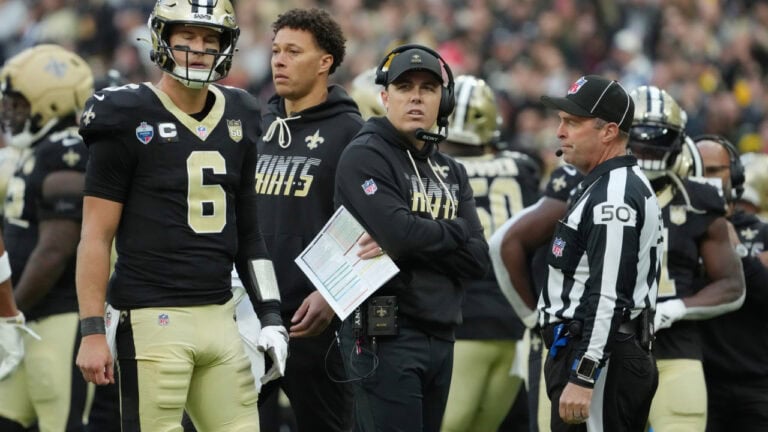
As the New Orleans Saints approach their bye week, there will be no opponent to compare the team to heading into the weekend.
Instead, comparing the team’s performance this season to last year reveals several internal issues. The club has regressed in several key metrics that contribute to its success.
Comparing the Saints’ first seven games of 2026 to the same stretch last season doesn’t tell the full story. Instead, examining Tyler Shough’s first seven starts last season alongside his seven games this year provides a more accurate picture of the team’s progress and where it may be headed.
The Method
This is not a comparison of Shough’s performance, but instead a comparison that includes his impact as the team’s starting quarterback in order to remove as many variables as possible when measuring one year against another.
Last year’s Weeks 9 through 16 offered the team its seven looks with its new starter, going 4-3 over those games.
Meanwhile, a look at the team’s Weeks 1 through 7 here in 2026 (2-5) offers an extended look at the team with all of its pieces in place, sans the injured players that have impacted both stretches.
This range also keeps wide receiver Chris Olave in the mix, as he missed Week 18 of the 2025 season, hence avoiding looking over the final seven games of last season.
One Key Factor
One key factor to consider: strength of schedule and quality of opponent.
During the Saints’ 4-3 run in 2025, the club faced the eighth-easiest schedule over the span of weeks, facing opponents with a combined .454 win average.
So far, through the first seven games of the season in 2026, New Orleans has faced the fourth-highest quality of opponent, facing a combined win rate of .613.
Scoring Offense vs. Scoring Defense (Points Per Game)
2026 Saints Offense – No.17 (23.1) | 2025 Saints Offense – No. 27 (18.1)
2026 Saints Defense – T-No. 27 (27.7) | 2025 Saints Defense – No. 6 (18.4)
There’s been a lot of talk about the Saints’ scoring ability on offense, but the defense has had a steep decline in the scoring category.
During Shough’s first seven starts last season, the Saints’ defense allowed touchdowns on 17.6% of opponents’ drives. This season, that rate has climbed to 28.6%, the eighth-highest in the NFL.
The 2026 defense has faced plenty of sudden-change situations, but the numbers closely mirror last season. Opponents’ average starting field position differs by just 1.5 yards between the two stretches.
The defense has also faced a similar number of drives following offensive turnovers, including fumbles, interceptions and turnovers on downs: 15 in 2026 compared to 16 during the same seven-game stretch in 2025.
Point Differential
2026 Saints – minus-32 (No. 26) | 2025 Saints – minus-2 (No. 16)
This has much to do with the defense. Both offenses haven’t necessarily rained points, though the 2026 offense has put up 30 or more twice in seven games.
This one really comes down to the number of points allowed by Defensive Coordinator Brandon Staley’s unit.
This is also another place where the quality of the opponents faced could be a factor. The 2026 Saints defense has allowed nearly 70 more points over the seven-game span from last year; 194 (third-most so far in 2026) to 129 (third-best).
Passing Offense vs. Passing Defense (Yards Per Game)
2026 Saints Offense – No. 15 (229.7) | 2025 Saints Offense – No. 10 (223.6)
2026 Saints Defense – No. 25 (233.3) | 2025 Saints Defense – No. 3 (155.9)
Shough has thrown the ball considerably more than expected this season. He’s No. 3 in the NFL right now with 273 passing attempts vs. the 239 (No. 14) he had in last year’s span. With that, he’s averaging just over six more passing yards per contest.
The team’s lower ranking across the league despite a higher average has to do with more passing success around the NFL. It’s also a signal of how much better defenses get later in a year after typical slow starts.
New Orleans hopes its defense can return to last season’s form before the year ends. During Shough’s first seven starts in 2025, the Saints ranked third in passing defense.
That ranking has dropped to 25th through seven games in 2026. The decline, combined with struggles in the running game, has placed even more pressure on Shough and the offense.
Rushing Offense vs. Rushing Defense (Yards Per Game)
2026 Saints Offense – No. 28 (86.0) | 2025 Saints Offense – No. 29 (91.9)
2026 Saints Defense – No. 29 (139.4) | 2025 Saints Defense – No. 22 (128.4)
It’s hard to believe that the Saints’ rushing game right now ranks higher than it did in Shough’s first seven starts. However, that’s only because of other poor rushing performances out across the league.
Statistically, the rushing offense has taken a step back from what was already a bad showing last year.
The Saints are averaging almost six rushing yards fewer than Shough’s first starts with rushing attempts falling from 188 to 171 and a rushing yards per carry average that’s basically the same; 3.5 versus 3.4 last season.
Despite the team’s investments in this area on the offensive side of the ball, the benefits haven’t yet come to fruition. Though running back Travis Etienne Jr. is eligible to return after the Week 7 loss.
Both rushing defenses struggled, though this year’s 4.8 rushing yards per carry allowed is a concerning rate, tied for the third-highest surrendered in the NFL.
New Orleans was much better positioned when Shough took the helm last year with a 4.1 average allowed over his first seven starts, No. 13 in the league.
Turnover Differential
2026 Saints – minus-4 (T-No. 28) | 2025 Saints – minus-1 (T-No. 21)
This may not look like much, but considering the number of turnovers is significant.
The Saints have given the ball away 13 times this season (as opposed to nine in this comparison group). The Saints are tied for the third-most giveaways across the league this year.
Third Down Conversion Rate
2026 Saints Offense – 43.4% (No. 8) | 2025 Saints Offense – 40.9% (No. 15)
2026 Saints Defense – 47.8% (No. 29) | 2025 Saints Defense – 32.6% (No. 3)
Here’s a rare occasion where the Saints’ offense has gotten better but the defense has gotten worse.
Two big focuses for Head Coach Kellen Moore during the offseason were improvements in both third down and red zone situations. Here on third down, the team has not only maintained its late-season success from last year, but has also improved upon it.
Meanwhile, the defense has taken a major step backwards falling from top-three to bottom-four.
This may be the best example of how game flow has impacted the team’s success. While the offense struggles to score consistently and move the ball on the ground, the defense has struggled to get off of the field.
That’s typically not a winning combination.
Red Zone to Touchdown Efficiency
2026 Saints Offense – 77.3% (No. 2) | 2025 Saints Offense – 36.8% (No. 31)
2026 Saints Defense – 56.7% (No. 15) | 2025 Saints Defense – 50.0% (T-No. 8)
This might be one of the most significant crowning achievements for Moore, along with third-down rate.
He has taken his offense, with Shough involved, from the second-worst NFL team in converting red zone possessions into touchdowns to the second best. Over the offense’s 22 red zone possessions, it has converted 17 touchdowns
Meanwhile, the defense has allowed touchdowns on a similar percentage of red zone possessions. However, opponents have scored 17 touchdowns in 30 red zone trips this season, compared to eight in 16 trips during last year’s stretch.
The increase in scoring opportunities highlights another area where New Orleans has struggled.
Pressure Rate Allowed vs. Generated
2026 Saints Offense – 35.5% (No. 15) | 2025 Saints Offense – 29.9% (No. 5)
2026 Saints Defense – 28.7% (No. 32) | 2025 Saints Defense – 32.2% (No. 24)
While edge rushers Chase Young and Carl Granderson are off to fast starts the year, each ranking in the top-five of sacks accumulated this year, there just hasn’t been much help otherwise.
With a total of 18 sacks on the season as a team, Young (seven) and Granderson (5.5) have contributed 12.5 themselves. The team’s next leading defender in sacks is linebacker Pete Werner with two.
Although the offense has given up a larger pressure percentage, they’ve cut sacks in these two samples from 23 to 15. Over the course of Shough’s first nine starts in 2025, he was sacked an average of 3.22 times per game.
This year, that average has come down to 2.14, just below the league’s average.