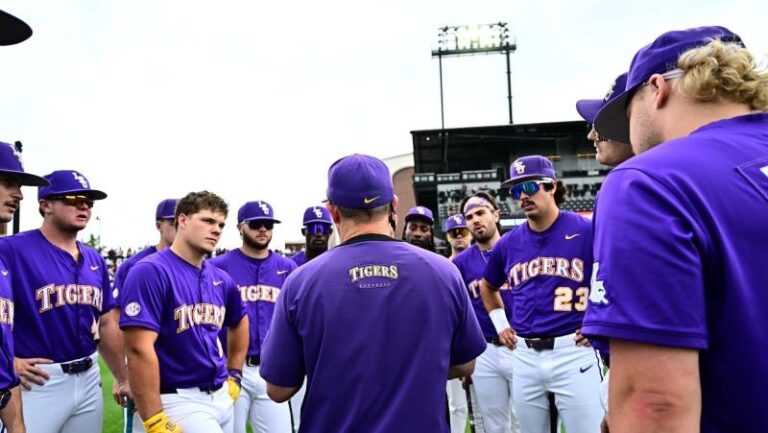
Six weeks are in the rearview, and eight more are to come.
LSU has not played to its standard to this point. That’s evidenced by the team’s overall and conference records. It’s also evident in the polls that do not include the Tigers in the top 25. What stands out is that it’s not one problem that is consistently cropping up for the Tigers.
The offense has been inconsistent. They scored runs at Vanderbilt. The pitching faltered. At times the pitching has been excellent. Then the offense falls asleep. The defense has been an issue all season.
Here’s a look at how the Tigers stack up against their SEC brethren across the board.
(First is always best, and 16th is always worst)
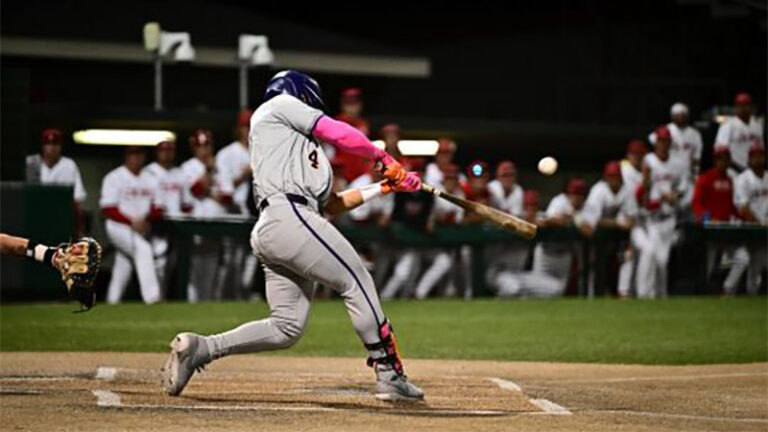
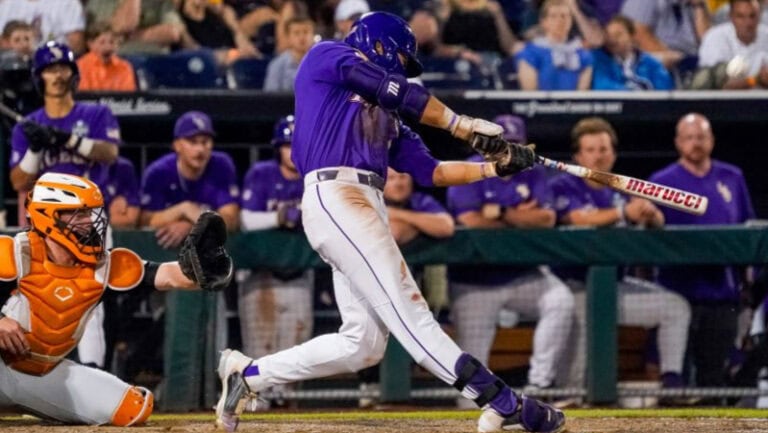
OFFENSE
Batting Average: 13th
Runs: 5th
Hits: 10th
Doubles: 12th
Home Runs: 9th
Slugging: 11th
Walks: 1st
Hit By Pitches: 6th
Strikeouts: 7th
On Base Percentage: 8th
Stolen Bases: 13th
PITCHING
ERA: 15th
Hits Allowed: 9th
Walks: 13th
Strikeouts: 1st
Doubles Allowed: 6th
Home Runs Allowed: 9th
Opponent Batting Average: 6th
Wild Pitches: 16th
Hit Batters: 13th
Fielding Percentage: 14th